Inventory Aging Is Killing Your Margins: The True Cost of Slow Liquidation Sales
By Deallo16 min read
Inventory aging in liquidation wholesale typically destroys 20-40% of recovery value within 60-90 days through daily depreciation, warehouse holding costs, and missed buyer demand windows (plslogistics.com). Slower sell-through directly compounds carrying costs, ties up working capital, and forces deeper discounts, turning profitable inventory into breakeven or loss-generating stock. Speed to sale is everything.
Published: April 28, 2026 | Last Updated: April 28, 2026
How Inventory Aging Destroys Recovery Value in Liquidation Wholesale
Returned and overstock goods do not depreciate in a straight line. Value loss accelerates sharply at 30, 60, and 90-day thresholds, and the compounding effect is brutal. According to the National Retail Federation, retailers expect ~16% of annual sales to be returned, roughly $850 billion in merchandise annually (bstock.com). That volume creates intense competition among liquidators. The sellers who move inventory fastest capture the most value. Those who don't pay twice: once in depreciation, and again in carrying costs. Active buyers on secondary market platforms filter listings by recency as their default. A pallet listed on day 3 competes very differently than the same pallet listed on day 45. Delayed listings miss peak buyer interest cycles and suppress bidding competition, which is the engine of recovery rate optimization. The gap between a fast-listed lot and a slow-listed one isn't marginal. It defines profitability.
The Depreciation Curve: What Happens to Value Over Time
Consumer electronics can lose 30-50% of resale value within 90 days of being returned (plslogistics.com). Seasonal goods such as apparel and holiday items face cliff-edge value drops the moment peak season closes. General merchandise depreciates more slowly but still loses meaningful value over 60 days without a completed sale. Manifested pallets command higher prices when listed within the first 2 weeks of receipt, before buyer assumptions about condition and completeness begin to harden. The eCommerce return rate hit 20% in 2025 (upcounting.com), meaning the volume of aging-vulnerable inventory entering the secondary market has never been higher. That supply pressure means buyers have options. They can and will wait for desperate sellers to cut prices rather than pay fair value on a stale listing.
Why Buyer Behavior Amplifies Aging Penalties
Experienced wholesale buyers track listing age. They use it as a negotiating lever, and they are disciplined about it. Aged inventory signals hidden problems to a buyer: condition issues, incomplete manifests, high breakage rates, or items that other buyers already passed on. That perception suppresses inquiries, reduces competitive bidding, and pushes final prices down even when the actual merchandise quality is unchanged. Stale listings on platforms like B-Stock, which aggregates auctions from 50+ marketplaces (bstock.com), generate fewer bids and close at lower multiples. The seller's only remaining lever is price reduction. At that point, the inventory is no longer generating margin. It is simply recovering losses.
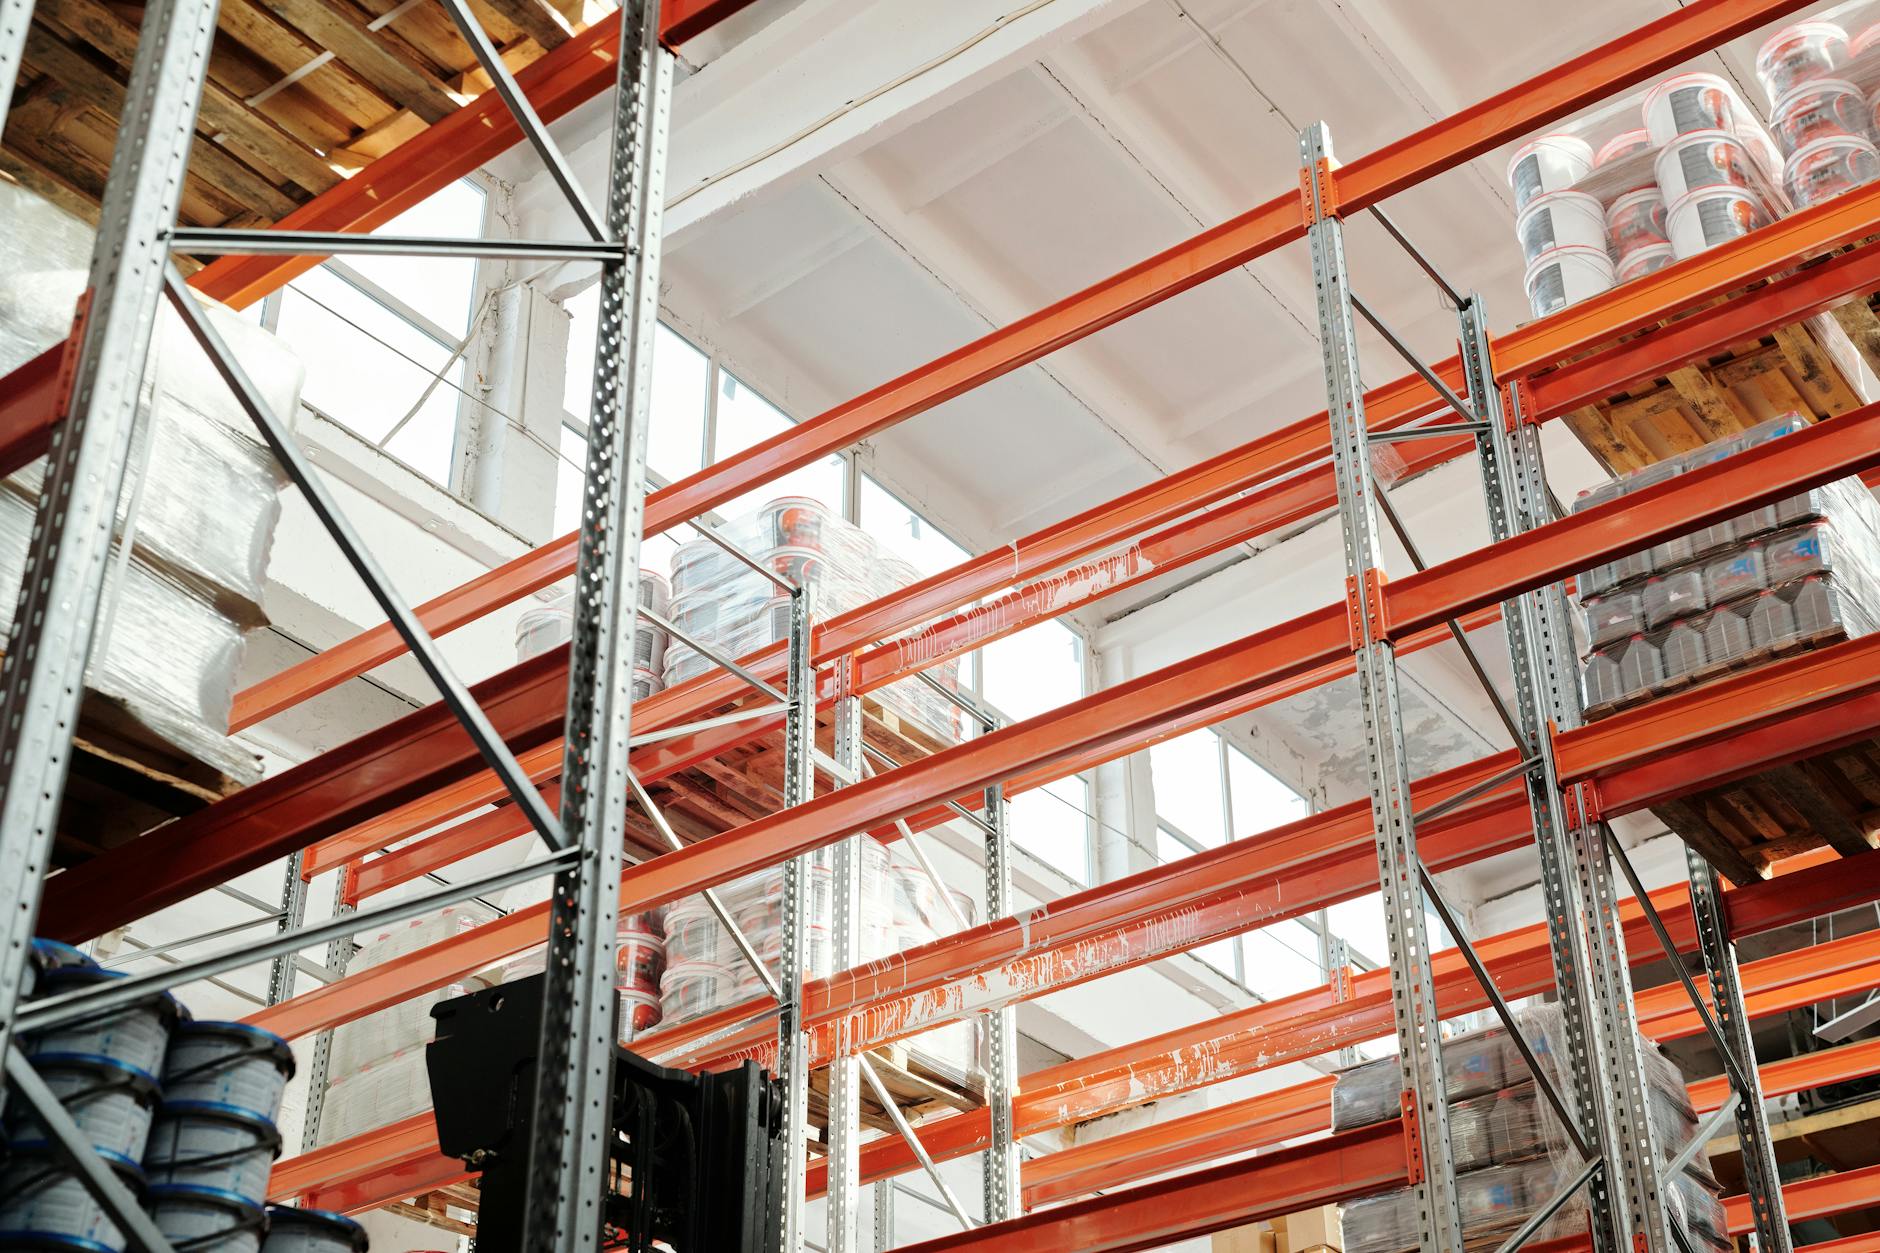
The Full Cost Stack: Carrying Costs Most Liquidators Undercount
Most liquidation wholesalers track direct storage fees. Few track the full cost stack, and the gap between the two numbers is where margin disappears silently. Liquidation wholesalers incur 25-30% annual carrying costs on the total value of inventory sitting too long in the warehouse, encompassing storage, insurance, utilities, labor, and opportunity costs (industrialsupplytrends.com). On a $1 million inventory position, that is $250,000 to $300,000 per year in carrying cost alone, or roughly $685 to $822 per day (tratta.io). That number does not appear on any single line item in most P&Ls, which is exactly why it stays invisible. Retailers have learned this lesson painfully. McKinsey & Company estimates retailers spend $200 billion annually managing the reverse logistics burden of returned goods (bstock.com). The cost of holding is real. Most liquidators just haven't built the systems to see it clearly.
Direct Holding Costs: Storage, Labor, and Shrinkage
Those touches add up fast. Shrinkage and damage rates also increase measurably after 90 days in warehouse environments as goods are jostled, packaging deteriorates, and small items go missing. A critical but underappreciated factor: Amazon's 2026 aged inventory surcharges apply to FBA sellers holding inventory beyond 181 days, creating a hard cost penalty model that mirrors what liquidation wholesalers face in their own facilities. The principle is the same whether the warehouse is yours or Amazon's. Time costs money in storage.
Hidden Costs: Opportunity Cost and Capital Lock-Up
For a 10% bulk purchase discount, consider this: that discount vanishes if stock sits over nine months due to carrying charges (industrialsupplytrends.com). The economics of a great sourcing deal can be completely erased by slow turn. Capital locked in unsold inventory cannot fund new truckload or pallet purchases at favorable prices. Sourcing windows for high-margin retailer overstock are time-sensitive. Liquid capital wins deals. Warehouse space consumed by slow-moving inventory blocks receipt of faster-turning merchandise that could generate better margins. The ideal inventory turnover benchmark for distribution is 7-8 times per year. Companies turning inventory only 4 times annually are leaving significant margin on the table compared to best-in-class operators, not because they sourced worse, but because they sold slower.
| Cost Category | Low Estimate | High Estimate | Notes |
|---|---|---|---|
| Direct storage per pallet per day | $4 | $12 | Varies by facility type and location |
| Labor per re-handle touch per pallet | $15 | $40 | Beyond initial receiving |
| Annual carrying cost as % of inventory value | 25% | 30% | Includes insurance, utilities, opportunity cost |
| Recovery value loss by day 90 (electronics) | 30% | 50% | Category-dependent |
| Recovery value loss by day 60 (general merchandise) | 15% | 25% | Slower curve, still significant |
| Opportunity cost of capital locked in unsold inventory | Varies | Varies | Often exceeds direct storage fees |
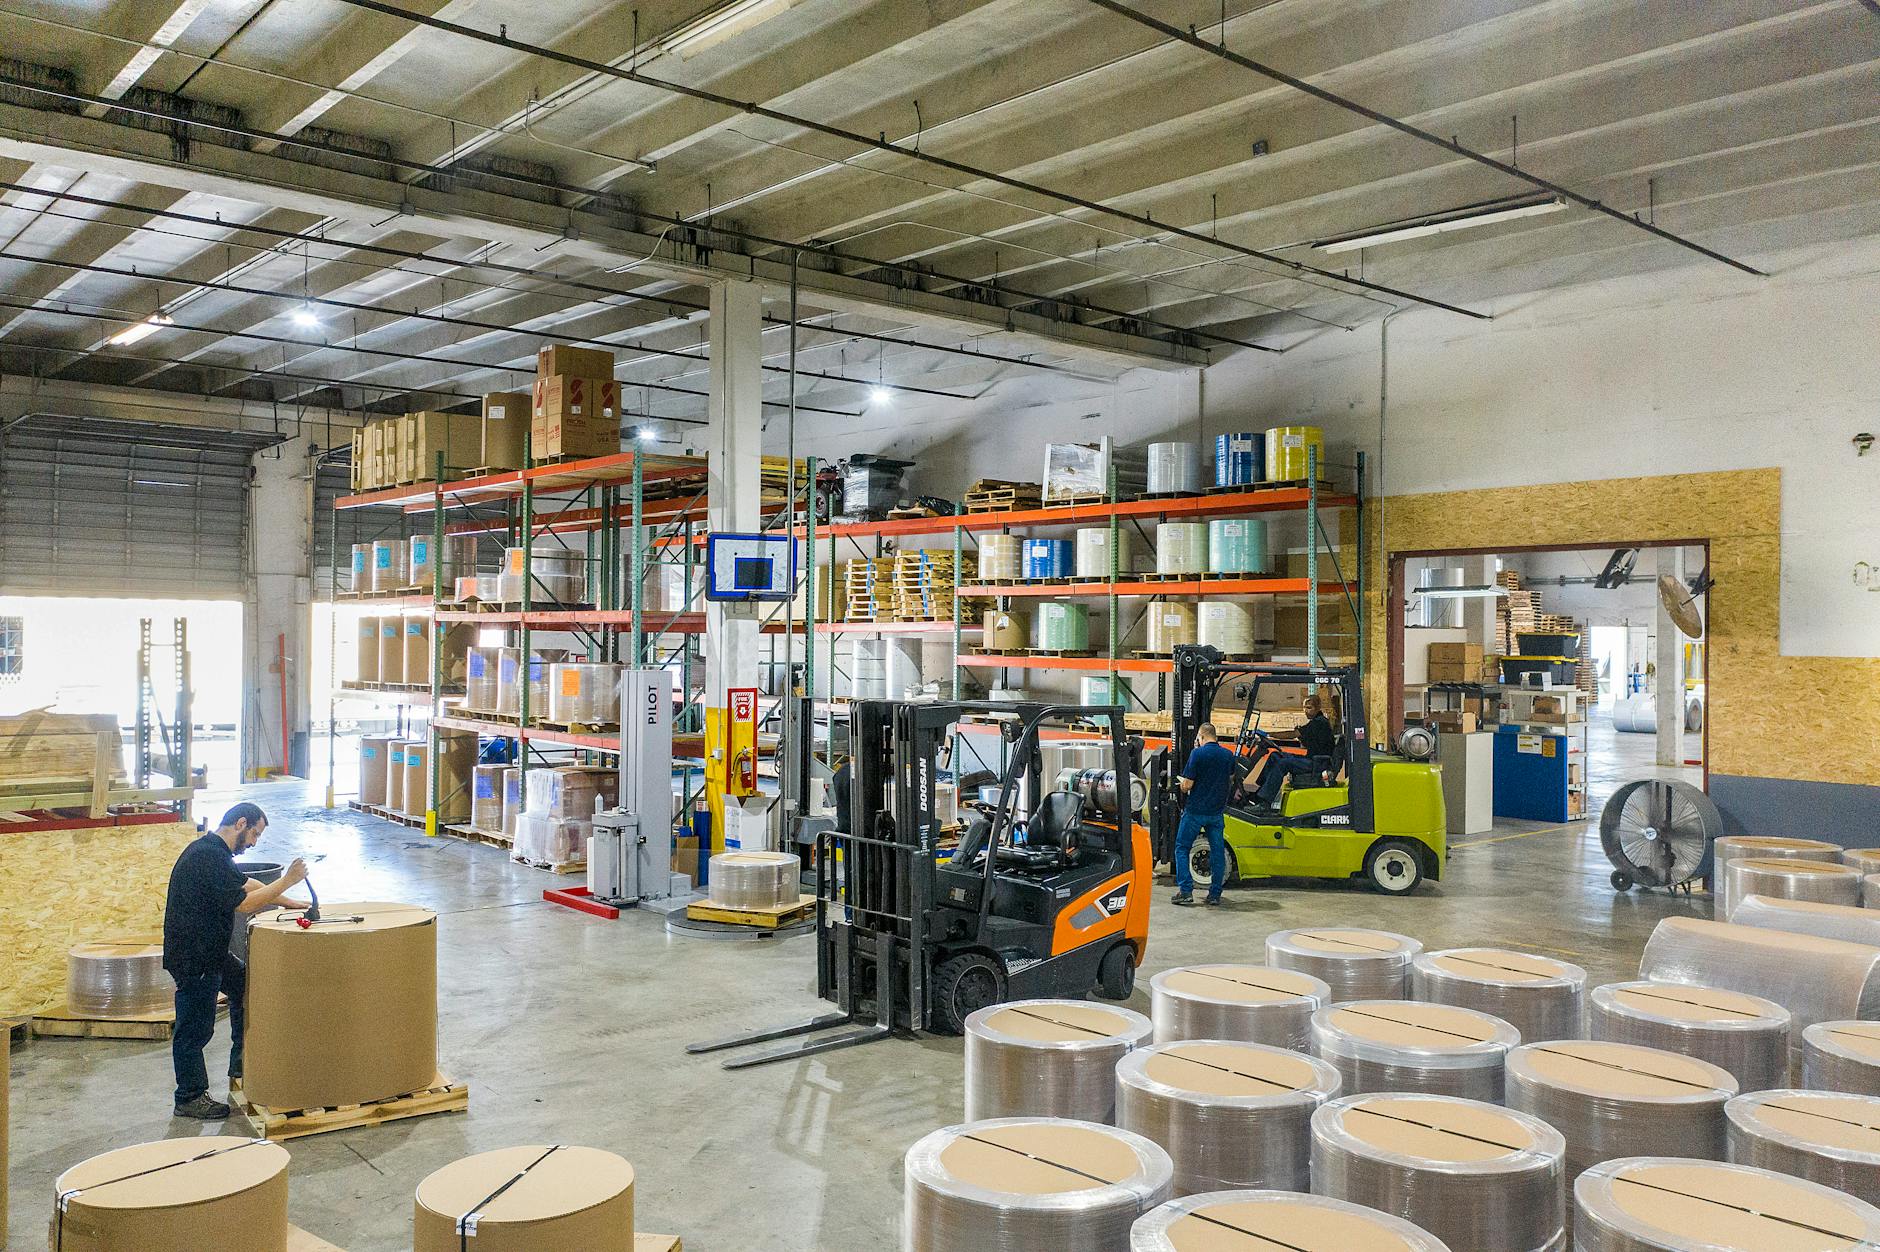
Manual Sales Processes: How Operational Inefficiency Speeds Up Aging
Most liquidation wholesalers still run on spreadsheets, email chains, and phone calls. The problem is not effort. The problem is capacity. Sales reps spend only 30% of their time actually selling, while admin work, internal meetings, and outdated processes consume the rest (everstage.com). Manual quoting and follow-up cycles add 3-7 days to average time-to-sale per lot. That delay, compounded across dozens of active lots, is not a minor inefficiency. It is a structural aging accelerant built into your process. At Deallo, we see this pattern consistently across new clients: the biggest margin leak isn't sourcing or pricing. It's the gap between inventory receipt and first qualified buyer contact.
The Quoting Bottleneck and Its Cost
A single sales rep quoting 50+ SKUs per pallet manually can spend 45-90 minutes per lot on pricing research, email drafting, and follow-up tracking. Meanwhile, buyers are comparing options from multiple sellers. Response time is a conversion variable. Companies that replaced manual forms with AI agents saw close rates improve from 12% to 20% and cut customer acquisition cost by 68% (patagon.ai). Slow quoting pushes buyers to competitors who can turn manifests faster. In liquidation wholesale, that buyer loss doesn't just cost one sale. It costs the relationship, the recurring volume, and every future lot that buyer would have purchased. Fast response time is a retention strategy, not just a sales tactic.
Inconsistent Pricing and Its Compounding Damage
Human pricing decisions vary by rep, time of day, and perceived buyer relationship. Buyers learn this quickly. A buyer who receives inconsistent quotes across multiple interactions will delay purchases, wait for the desperate-seller discount, and train your team to accept lower prices over time. That dynamic is invisible in week one. It becomes a margin problem in month six. Automated AI sales systems can handle hundreds of concurrent buyer conversations simultaneously, while human reps realistically manage 20-40. The same AI implementation data shows leads can multiply by 24x when manual processes are replaced with intelligent automation (patagon.ai). Consistent, data-driven pricing benchmarked against real transaction history doesn't just protect margins on individual lots. It reshapes buyer expectations over time.
Measuring the True Recovery Rate Impact of Aging Across Product Categories
Recovery rate is the core profitability metric in liquidation wholesale: the percentage of original retail value recaptured through the sale. Category matters enormously. Consumer electronics and apparel age fastest. Hard goods and tools hold value longer. But most liquidation wholesalers do not track recovery rate by category and aging cohort simultaneously, which means the worst-performing categories stay hidden in blended averages. The 90-Day Sunset Rule is a best practice framework that treats 90 days as a hard deadline for selling or re-routing inventory. Any lot still unsold at 90 days should trigger an automatic pricing and routing review, not a waiting game. Applying this rule systematically prevents the gradual slide from recoverable asset to liability that happens when aging inventory is simply left in place without intervention. Companies that track aging by category and adjust pricing dynamically report meaningfully higher recovery rates than those using static pricing and reactive selling.
Category-by-Category Aging Risk Profile
Consumer electronics carry the highest velocity depreciation and the best recovery within the first 30 days. After 60 days, buyers assume generation-gap issues, missing accessories, or resale competition from newer models. Apparel and footwear are season-dependent. A pallet of winter outerwear purchased in November and unsold by March faces a cliff-edge value drop as the seasonal selling window closes. Home goods and furniture depreciate more slowly but consume disproportionate warehouse space, making their carrying cost per square foot higher than their unit value suggests. Tools and hardware hold the most durable recovery value and tolerate longer sales cycles without major margin loss. Health and beauty products carry regulatory and expiration constraints that create hard depreciation deadlines regardless of buyer demand. Every category needs its own aging threshold and pricing response cadence.
How to Calculate Your Real Recovery Loss from Aging
Here is the formula most liquidation wholesalers have never run at the lot level: (Expected Day-1 Recovery Value minus Actual Recovery Value) plus Total Carrying Costs During Hold Period equals your true aging loss per lot. Consider a concrete scenario. Assume a liquidator receives a pallet of consumer electronics with a Day-1 recovery value of $1,200. Most companies never calculate this figure at the lot level. Building a simple aging dashboard by category reveals which product types are causing the most margin destruction. Even a 5% improvement in average recovery rate on a $10 million annual inventory position equals $500,000 in additional margin per year (bstock.com). That number justifies significant investment in faster, smarter selling processes.
Strategies to Reduce Inventory Aging and Protect Liquidation Margins
The highest-leverage intervention in liquidation wholesale is speed to list. Getting inventory listed within 48 hours of receipt captures maximum buyer interest before the aging clock starts working against you. Standardized manifest processing workflows reduce intake-to-listing time from days to hours. Pre-built buyer preference profiles enable immediate routing of new inventory to the highest-probability buyers, compressing time-to-sale without requiring manual research on every lot. Setting hard internal SLAs, such as 48-hour listing targets and 90-day sunset reviews, creates accountability and generates measurable improvement over time. These are not complex technology projects. They are process disciplines that any liquidation wholesaler can implement and that AI-powered platforms can enforce automatically at scale. The goal is removing friction from every step between inventory receipt and cash in hand.
Accelerating Time-to-List and Time-to-Sale
Automated listing generation from manifest data eliminates the single biggest manual bottleneck in the sales pipeline. When a new truckload arrives, the system processes the manifest, generates structured listings, and routes them to qualified buyers immediately, without waiting for a sales rep to start a spreadsheet. AI-driven pricing engines then analyze historical transaction data, current buyer demand signals, and aging timelines to set optimal prices at listing. This is where AI sales automation is delivering 10-20% sales ROI improvements in B2B contexts (superagi.com), and liquidation wholesale is one of the highest-leverage applications because the time sensitivity of inventory value is so extreme. Faster listing means more competitive bidding, higher close prices, and less aging exposure.
Dynamic Pricing and Automated Buyer Outreach
Automated outreach sequences contact qualified buyers immediately upon listing, without waiting for inbound inquiries. Systematic follow-up automation ensures no buyer inquiry goes unanswered for more than hours. Platforms like Deallo automate the full sales cycle from pricing to negotiation to close, freeing sales reps to focus on high-value relationship building and sourcing rather than repetitive quoting tasks. The reverse logistics data supports this model: efficient inventory management practices, like those Walmart implemented to grow inventory at just 0.7% against a 5.8% sales increase (plslogistics.com), demonstrate that disciplined sell-through processes generate compounding margin gains over time. The companies that win in liquidation wholesale are not the ones with the most inventory. They are the ones who move it fastest.
Frequently Asked Questions
What is inventory aging in liquidation wholesale and why does it matter?
Inventory aging refers to the length of time returned, overstock, or excess inventory sits unsold in a warehouse before being sold to a buyer. It matters because liquidation goods depreciate non-linearly, with value losses accelerating at 30, 60, and 90-day thresholds. Aging increases carrying costs, erodes recovery rates, and ties up working capital that could fund better-margin sourcing deals.
How much value does liquidation inventory lose per day it sits unsold?
The daily value loss depends heavily on product category. Consumer electronics can lose 30-50% of resale value within 90 days. General merchandise loses 15-25% over 60 days. Carrying costs of 25-30% annually add a compounding financial burden on top of depreciation, meaning the total daily loss is both a market value decline and a cash flow drain.
What is a good recovery rate for liquidation wholesale inventory?
Recovery rate benchmarks vary by category, condition, and time-to-sale. Electronics listed within 30 days typically command the highest rates. General merchandise averages vary widely. The key lever is minimizing aging: companies that track aging by category and apply dynamic pricing systematically report meaningfully higher recovery rates than those using static pricing. Even a 5% improvement on $10 million in annual inventory volume equals $500,000 in additional margin.
Which product categories depreciate fastest in the liquidation market?
Consumer electronics depreciate fastest, losing 30-50% of resale value within 90 days due to rapid technology cycles and buyer assumptions about condition. Apparel and footwear face cliff-edge drops after seasonal windows close. Health and beauty products have hard expiration deadlines. Tools and hardware are the most resilient, holding recovery value through longer sales cycles without significant margin loss.
How do manual sales processes contribute to inventory aging costs?
Sales reps spend only 30% of their time actually selling, with the rest consumed by admin and follow-up tasks. In liquidation wholesale, that inefficiency adds 3-7 days to time-to-sale per lot. Manual quoting, slow follow-up, and inconsistent pricing compound aging by delaying buyer contact and reducing close rates during the highest-value window after inventory receipt.
What is the average carrying cost for liquidation inventory per pallet per day?
Direct storage costs range from $4 to $12 per pallet per day depending on facility type and location. When insurance, labor for re-handling, shrinkage risk, and opportunity cost are included, total carrying costs reach 25-30% of inventory value annually. On a $500,000 inventory position, that translates to approximately $342 to $410 per day in total carrying burden across the full position.
How can AI-powered tools reduce inventory aging in liquidation wholesale?
AI tools reduce aging by automating three critical bottlenecks: manifest processing and listing generation, buyer matching and outreach, and dynamic pricing based on aging timelines and demand signals. Companies using AI sales automation have seen close rates improve from 12% to 20% and lead volume increase by 24x. Faster listing, faster outreach, and consistent pricing compress time-to-sale and protect recovery rates.
What metrics should liquidation wholesalers track to identify aging problems early?
The five most critical metrics are: time-to-list by category, time-to-sale by category and aging cohort, recovery rate versus Day-1 expected value, carrying cost per lot during hold period, and sell-through rate by product type and buyer segment. Tracking these at the lot level reveals which categories and processes are generating the most margin destruction before the damage becomes irreversible.
What are the average carrying costs for inventory sitting in warehouses?
Industry data places total carrying costs at 25-30% of inventory value annually for liquidation and wholesale distribution operations. This encompasses direct storage fees, insurance, utilities, labor for handling and re-inspection, shrinkage, and opportunity cost of locked capital. Many operators only track direct storage fees, which causes them to systematically underestimate the true cost of slow inventory turn.
How do storage fees impact the profitability of holding inventory?
Storage fees erode profitability in two ways. Direct fees reduce net recovery on every lot held beyond its optimal sell window. Indirect impact comes from space consumed by slow-moving goods blocking receipt of faster-turning, higher-margin inventory. A 10% bulk purchase discount can be completely erased if the acquired stock sits over nine months due to accumulated carrying charges, turning a favorable sourcing deal into a loss.
What strategies can liquidation wholesalers use to minimize losses from slow-moving inventory?
The most effective strategies are: listing inventory within 48 hours of receipt, applying dynamic pricing that adjusts automatically based on aging thresholds, building a tiered buyer network with varied risk appetites, enforcing a 90-day sunset rule that triggers mandatory price reviews, and using automated buyer outreach to contact qualified buyers immediately upon listing rather than waiting for inbound inquiries to arrive organically.
How does the 90-day sunset rule help in managing surplus inventory?
The 90-day sunset rule establishes a hard deadline: any inventory unsold at 90 days triggers an automatic pricing and routing review. This prevents the passive aging that occurs when slow-moving inventory is simply left in place without intervention. It forces a structured decision: discount aggressively, re-route to a different buyer segment, or bundle with faster-moving lots to accelerate clearance before carrying costs eliminate all remaining margin.
What are the long-term effects of holding onto slow-moving inventory?
Long-term holding creates a compounding margin problem. Direct effects include accumulated carrying costs, depreciation, and shrinkage. Indirect effects include capital starvation, preventing reinvestment in higher-margin sourcing opportunities, and buyer relationship damage as stale listings signal operational dysfunction. Over time, chronic slow turn trains your buyer base to expect distressed pricing, structurally lowering recovery rates you can achieve even on fresh inventory.
Sources & References
- Full Warehouse, Empty Wallet: The Surplus Inventory Trap - Industrial Supply Trends[industry]
- The Average eCommerce Return Rate Hit 20% in 2025 - Upcounting[industry]
- How AI is Boosting Sales ROI by 10-20% - SuperAGI[industry]
- Sales Productivity Statistics: Trends & Data for 2026 - Everstage[industry]
- How to Calculate the True Cost of Manual Sales Processes - Patagon AI Blog[industry]
- What Your Inventory Reveals about Your Reverse Logistics - PLS Logistic Services[industry]
- How AI and Data Speed Up and Scale B2B Resale - B-Stock Solutions[industry]
About the Author
Deallo
Deallo is an AI-powered sales agent platform that automates inventory liquidation for wholesale companies, helping them sell returned and excess stock while maximizing recovery value efficiently.
Related Posts
The Ultimate Guide to AI-Powered Buyer Matching and Manifest Selling in Liquidation
Most liquidation wholesalers still rely on spreadsheets and phone calls to move complex, heterogeneous inventory. AI-powered buyer matching and manifest selling change that equation entirely. This guide breaks down how the technology works, what it delivers, and how to implement it.
12 min read

Salesforce vs. Liquidation-Specific Platforms: Why Generic CRMs Fall Short for Wholesale Liquidation
Salesforce is a powerful CRM, but it was built for predictable sales cycles with stable product catalogs. Wholesale liquidation operates by completely different rules. This guide breaks down exactly where generic CRMs break down and what liquidation-specific platforms do better.
10 min read
Automating Manifest-Based Selling: How AI Handles Pallet Grading and Liquidation Complexity
Liquidation wholesalers managing hundreds of heterogeneous pallets weekly face a near-impossible manual workload. AI platforms like Deallo now automate manifest parsing, pallet grading, dynamic pricing, and buyer matching. This guide explains exactly how that automation works and what it means for your recovery rates.
13 min read