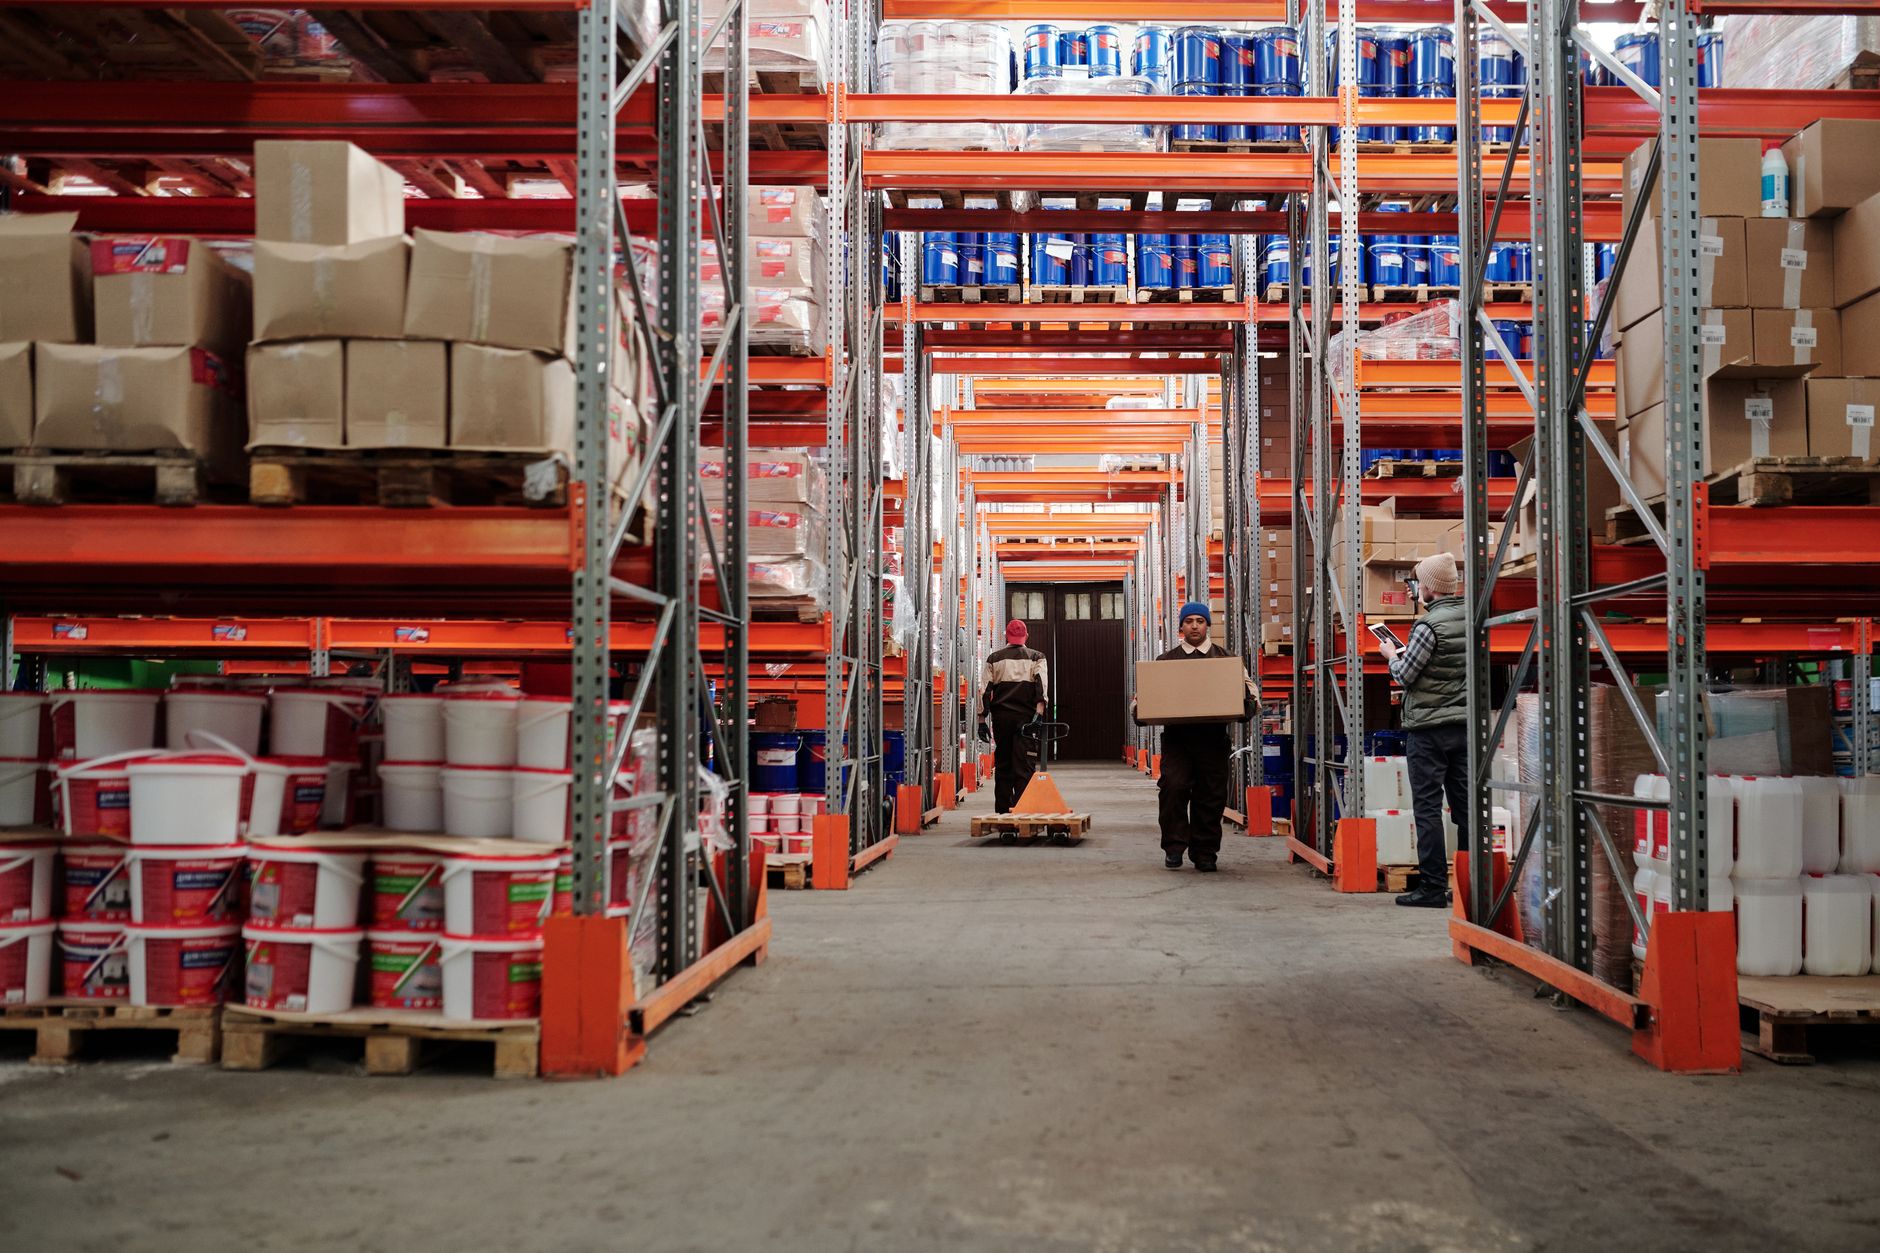
The $800B Opportunity: How Surging E-Commerce Returns Are Reshaping Liquidation Wholesale in 2026
E-commerce return rates averaging 18.4% are flooding secondary markets with returned and overstock inventory, pushing the global reverse logistics market from $773.4 billion in 2025 to $822.12 billion in 2026 (researchandmarkets.com). Wholesalers who modernize pricing, buyer matching, and sales workflows now are positioned to capture disproportionate market share before competition intensifies further.
Why Is the Liquidation Wholesale Market Approaching $800 Billion?
The numbers are striking. The global reverse logistics market hit $773.4 billion in 2025 and is projected to reach $822.12 billion in 2026 at a CAGR of 6.3% (researchandmarkets.com). By 2030, that figure climbs to $1.04 trillion (researchandmarkets.com). This is not a niche market. It is infrastructure-scale commerce, and liquidation wholesale sits at the center of it. The force driving it is simple: e-commerce is permanent, and the average online return rate across U.S. retailers climbed to 18.4% in 2026, up from 16.9% in 2024 (amraandelma.com). Every percentage point of return rate represents billions of dollars in merchandise that has to go somewhere. Brands and retailers cannot absorb the cost of holding or destroying that inventory. Increasingly, it moves through liquidation wholesale channels. The opportunity is also connected to a broader shift: nonstore retailers grew 12.2% year-over-year as of May 2026 (census.gov), confirming that online shopping volume, and therefore return volume, continues to expand. Inventory distortion, the combined cost of overstocks and out-of-stocks, already costs global retailers an estimated $1.77 trillion per year (vndly.io). That is the pool liquidation wholesale draws from.
Which Product Categories Are Generating the Most Return Volume?
Not all returned inventory is equal, and knowing which categories generate the most volume is essential for smart sourcing. Clothing leads all categories at a 29.6% return rate in 2026, followed by bags at 22.1% and shoes at 21.4% (amraandelma.com). The fashion average overall sits at 15.3% (amraandelma.com), while electronics come in at 9.7% and smart home devices at 13.2%. Home goods and furniture returns spiked during the pandemic and have remained elevated as consumers continue purchasing large-ticket items online. Health and beauty, toys, and seasonal goods are increasingly routed to liquidation channels due to shelf-life constraints that make restocking impractical. Electronics, even at 9.7% (amraandelma.com) return rate, generate some of the highest-value pallet loads in the [secondary market](/ how-to-turn-high-ecommerce-return-rates-into-predictable-revenue-liquidation-20260505) because of underlying unit prices. A single truckload of returned consumer electronics can carry retail value well above six figures, making recovery rate optimization especially critical in that category.
How Are Major Retailers Changing Their Liquidation Strategies?
Retailers are not passive participants in the liquidation market. They are actively reshaping it. Amazon Liquidations, Walmart Liquidation Auctions, and Target Reverse Logistics programs have all evolved into structured bulk-sale programs that offer manifested inventory to vetted wholesale buyers. Retailers are shortening return windows and accelerating the speed at which returned goods leave their facilities, driven by the carrying cost pressure that makes holding returns costly. Brand protection concerns are also pushing some major retailers toward tiered channel programs that favor established wholesale partners over open auction platforms, where brand visibility is harder to control. Truckload and [pallet manifest](/ automating-manifest-based-selling-ai-pallet-grading) transparency has improved considerably, with many major retail programs now providing SKU-level manifests that allow buyers to price more accurately before bidding. This shift raises the baseline expectations that buyers bring to every channel, including smaller regional liquidators who must now offer comparable transparency or risk losing buyer confidence to better-documented alternatives.
What Operational Challenges Are Preventing Liquidation Wholesalers from Capturing This Opportunity?
The market opportunity is large. The operational gap is real. Most liquidation companies with 10 to 200 employees still manage high-volume, heterogeneous inventory through spreadsheets, email threads, and phone calls. This is not a judgment. It reflects how the business was built before technology made better options accessible. The problem is that manual processes do not scale proportionally with volume, and volume is accelerating. When a 15-person sales team is already at capacity quoting, negotiating, and following up with 40 active buyers, absorbing 30% more inventory does not mean 30% more revenue (simplydepo.com). It means slower quotes, missed follow-ups, and buyers who quietly move their purchasing to competitors who respond faster. Reverse logistics is increasingly a profit center for well-run operators, but realizing that profit requires processing speed and pricing accuracy that manual teams cannot consistently deliver at scale. The bottlenecks compound: slow quoting leads to inventory aging, aging leads to condition degradation on return categories, and degraded inventory produces lower recovery rates that erode margin on the exact goods the business paid to acquire.
How Does Inventory Heterogeneity Make Manual Pricing Unsustainable?
Heterogeneity is the defining characteristic of liquidation inventory, and it is precisely what makes manual pricing difficult to scale. A single truckload may contain dozens of SKUs across three product categories, multiple condition grades, and varying levels of completeness. No two loads are identical. A sales rep pricing that load manually is making judgment calls based on experience, gut feel, and whatever partial demand signal they have from recent buyer conversations. That process works when volume is manageable. It breaks down when a team is processing multiple truckloads per week across different categories. Human pricing based on intuition produces inconsistent recovery rates and often leaves margin on the table for high-demand categories where buyer competition would support a higher opening price. It also introduces errors, incorrect SKU counts, misgraded condition, overstated retail value, that damage buyer trust and require costly renegotiation. As volume grows, the time required to price accurately simply outpaces what a fixed team can handle without adding headcount proportionally.
Why Does Slow Time-to-Sale Compound Into a Structural Problem?
Speed matters more in liquidation than in almost any other wholesale category. Time is not neutral in this business. Every day unsold inventory sits in a warehouse accumulates carrying costs, occupies space needed for incoming loads, and, on many return categories, loses condition value that cannot be recovered. A buyer who sends an inquiry and waits three days for a quote is a buyer who has already checked two other sources. If they find a comparable lot elsewhere, the relationship damage is real even if the transaction is recoverable. The structural problem emerges over months, not days. Slow time-to-sale ties up working capital that could be deployed to source new truckloads at favorable prices. Warehouses fill with aging inventory. Buyers who experience slow response patterns reduce their purchase frequency or stop reaching out proactively. Large players reporting improved results in the secondary market consistently cite faster clearance velocity as a primary driver. Winners in 2026 are operators who can move quickly, verify condition at intake, and convert returns into resale-ready inventory at lower processing cost per unit.
How AI-Powered Automation Is Changing the Liquidation Sales Process
AI automation in liquidation is not a distant trend. It is being implemented now by operators who recognized that manual processes were the binding constraint on their growth. At Deallo, we built an AI-powered sales agent platform specifically for this market because we saw the same pattern repeatedly: capable sales teams trapped in quoting and follow-up loops that consumed the hours they should have spent on strategic buyer development and sourcing. The core value proposition of AI automation in liquidation is not replacing relationships. It is eliminating the administrative friction that prevents relationships from scaling. Companies using predictive analytics in CRM and sales systems see an average 20% increase in sales productivity (simplydepo.com). In liquidation wholesale, where every percentage point of recovery rate translates directly to margin, that productivity gain compounds. Over 72% of wholesale and distribution businesses are already prioritizing investment in systems to improve efficiency and customer retention (simplydepo.com). The operators who move now build data advantages that become harder to replicate as their systems learn buyer preferences over time.
What Is the Difference Between Traditional Liquidation Sales and AI-Assisted Sales?
The process difference is worth making concrete. In a traditional liquidation sales workflow, a sales rep receives a manifest, reviews it manually, estimates pricing based on experience, drafts individual emails to relevant buyers, waits for responses, fields counteroffers, and manages the negotiation by phone or email. That cycle, from manifest receipt to accepted offer, can take three to seven days on a complex lot. An AI-assisted workflow ingests the same manifest, generates data-backed pricing based on historical sell-through rates and current buyer demand signals, matches the lot to the buyer segments most likely to purchase, sends personalized outreach automatically, and tracks engagement in real time. Time-to-first-offer drops from days to minutes on standard inventory types. The recovery rate improvement comes not just from speed, but from better buyer-inventory matching. The right buyer for a pallet of returned athletic footwear is not the same as the right buyer for a truckload of open-box smart home devices. AI systems make those distinctions at scale. Sales reps are freed to focus on high-value conversations and sourcing relationships that require human judgment.
How Does Buyer Relationship Quality Hold Up With Automated Systems?
This is the objection every experienced liquidation operator raises first, and it deserves a direct answer. Buyer relationships are the most valuable asset in this business. A well-designed AI platform personalizes outreach using each buyer's purchase history, preferred categories, and bid behavior. The communication feels relevant because it is relevant. Buyers receive offers that match what they actually buy, not broadcast blasts. Automation handles routine quoting and follow-up, which frees sales reps to invest more time in strategic conversations with top buyers who drive disproportionate revenue. Consistency improves as well. Buyers receive faster responses, clearer pricing, and more transparent manifests. That reliability builds trust. Buyers increasingly prefer digital, self-serve options for standard lot purchases and reserve personal contact for complex or large transactions. An [AI system that handles](/ best-ai-sales-automation-tools-reverse-logistics-2026) the former efficiently makes the latter more valuable and more frequent.
Key Strategies for Liquidation Wholesalers to Maximize Recovery Value in 2026
Operational strategy in liquidation wholesale comes down to three variables: how fast you move inventory, how accurately you price it, and how well your buyer network matches the inventory you actually receive. Build a tiered buyer network segmented by category expertise, purchase volume, and speed-to-close. Matching inventory to the right tier before outreach begins is the single highest-leverage action a sales team can take. Invest in manifest quality and condition grading at intake. Buyers who receive accurate manifests dispute less and close faster. Accurate intake data also enables better dynamic pricing, because the system knows what it is actually selling. Channel diversification matters: selling across direct outreach, B2B marketplaces, and auction platforms simultaneously creates competitive tension on each lot that consistently improves final sale price compared to single-channel approaches. The global liquidation services market is currently valued at $4,198.66 million and is projected to reach $6,699.61 million by 2033 (cognitivemarketresearch.com), which means the competitive field will grow. Operators who build [data-driven pricing and buyer-matching](/ ultimate-guide-maximizing-recovery-rates-liquidation-wholesa) systems now will widen their advantage as that growth arrives.
What Metrics Should Liquidation Wholesalers Track to Improve Performance?
Metrics focus attention. The four metrics that matter most in liquidation wholesale operations are recovery rate, average days-to-sale, buyer repeat purchase rate, and cost-per-transaction. Recovery rate, defined as sale price as a percentage of original retail value, should be tracked by category and by channel separately. A channel that generates 15% (simplydepo.com) recovery on electronics but 40% on apparel is sending a clear signal about where to concentrate inventory routing. Average days-to-sale per lot type identifies the specific bottlenecks in the sales pipeline. If truckload electronics consistently take longer to move than pallet lots of apparel, that is an actionable insight, not just a number. Buyer repeat purchase rate is a proxy for offer quality and relationship health. Declining repeat rate usually signals pricing accuracy problems, manifest quality issues, or communication gaps before buyer complaints escalate. Cost-per-transaction, including labor, platform fees, and outbound logistics, reveals the true margin per lot and surfaces where automation investment delivers fastest payback.
| Metric | What It Measures | Target Benchmark |
|---|---|---|
| Recovery Rate | Sale price as % of retail value | Varies by category; track monthly trends |
| Average Days-to-Sale | Pipeline velocity per lot type | Reduce quarter-over-quarter |
| Buyer Repeat Purchase Rate | Relationship health and offer quality | Rising trend signals healthy buyer network |
| Cost-Per-Transaction | True margin after all costs | Decreasing trend signals operational efficiency |
| Sell-Through Rate | % of lots sold within target window | Higher indicates better buyer-inventory matching |
What the Next 18 Months Look Like for Liquidation Wholesale
The reverse logistics market is on a trajectory toward $1.04 trillion by 2030 at a 6.1% CAGR (researchandmarkets.com), with some forecasts projecting a CAGR of 7.3% through 2035 (gminsights.com). Volume will not slow. New entrants are flooding the liquidation space, attracted by margin visibility on platforms like B-Stock, Liquidation.com, and BULQ. Competitive pressure will compress margins for operators relying on manual processes while rewarding those with faster, more accurate sales systems. Retailer programs will increasingly favor wholesale partners who can demonstrate fast clearance velocity and transparent reporting. This is already visible in how major retailer programs tier their preferred buyers. Speed and data quality are the qualifying criteria, not just purchase volume. Companies that build AI-powered sales infrastructure in 2026 will have a compounding data advantage: their pricing models improve as historical sell-through data accumulates, their buyer matching sharpens as purchase patterns build, and their operational efficiency widens the gap between them and competitors still managing the same volume manually.
How Should Wholesale Operators Prioritize Technology Investment in 2026?
Start with the highest-volume, most repetitive bottleneck, which is typically initial outreach and quoting, before expanding automation scope. That is where time bleeds fastest and where automation delivers measurable ROI in the shortest timeframe. Prioritize platforms with native integration to existing warehouse management systems and ERPs to avoid data silos and double-entry that undermine the efficiency gains automation is supposed to create. Evaluate vendors on recovery rate improvement and time-to-sale reduction, not feature lists. Any vendor who cannot show you reference outcomes in liquidation or wholesale distribution should not be at the top of your shortlist. Build internal data literacy so operations managers can read sell-through dashboards and act on pricing signals without depending on an IT team. The operators who treat data as a competitive asset, not a reporting burden, will separate from the field over the next 18 months. Speed is the product. Data is the engine.
Frequently Asked Questions
What is the current size of the global liquidation wholesale market?
Why are e-commerce return rates so high in 2025 and 2026?
How do liquidation wholesalers make money on returned inventory?
What is a recovery rate and what is a good benchmark for liquidation pallets?
How does AI pricing help liquidation wholesalers recover more value?
What types of inventory are best suited for liquidation wholesale channels?
How can a small liquidation company compete with larger operators in 2026?
What is the difference between a liquidation pallet and an overstock truckload?
How are e-commerce returns affecting liquidation wholesale margins in 2026?
Which companies are leading the secondary market for returns liquidation?
What are the best ways to source profitable liquidation pallets in 2026?
How can buyers tell quality pallets from junk in wholesale liquidation?
What trends will shape e-commerce returns and liquidation after 2026?
Sources & References
- Reverse Logistics Market Report 2026 - Research and Markets[industry]
- Reverse Logistics Market Size 2026-2035 - Global Market Insights[industry]
- Global Liquidation Service Market Analysis 2026 - Cognitive Market Research[industry]
- Monthly Retail Trade Sales Report - U.S. Census Bureau[gov]
- Best CRM for Wholesale Distribution (2026) - SimplyDepo[industry]
- TOP 20 E-COMMERCE RETURN RATE STATISTICS 2026 - Amra and Elma[industry]
- Bad Inventory Costs Retailers $1.77 Trillion: 2026 Data Roundup - VNDLY[industry]
About the Author
Deallo
Deallo is an AI-powered sales agent platform that automates inventory liquidation for wholesale companies, helping them sell returned and excess stock while maximizing recovery value efficiently.
Learn more at deallo.ai →Related Posts

Handling Seasonal Liquidation Surges: How AI Adapts to Holiday Returns and Inventory Spikes
Holiday return seasons flood liquidation wholesalers with more inventory than manual teams can move efficiently. AI-powered sales platforms change that equation by automating pricing, buyer matching, and follow-up at scale. This guide breaks down exactly how AI adapts to seasonal surges to protect recovery rates and cash flow.
Reading the Data: How to Use Sell-Through Analytics to Maximize Liquidation Revenue
Most liquidation wholesalers are sitting on a goldmine of untapped data—and leaving recovery value on the table because of it. This guide breaks down exactly how sell-through analytics work, what metrics actually matter, and how to turn raw inventory data into faster sales and higher margins.

The Complete Digital Transformation Roadmap for Liquidation Wholesalers in 2026
Most liquidation wholesalers still run on spreadsheets, phone calls, and manual follow-ups, even as e-commerce return volumes hit record highs. This guide lays out a practical, step-by-step digital transformation roadmap so your operation can move inventory faster, price smarter, and scale without adding headcount.